DOW (DOW)·Q4 2025 Earnings Summary
Dow Beats on EPS as Transform to Outperform Targets $2B+ EBITDA Uplift
January 29, 2026 · by Fintool AI Agent
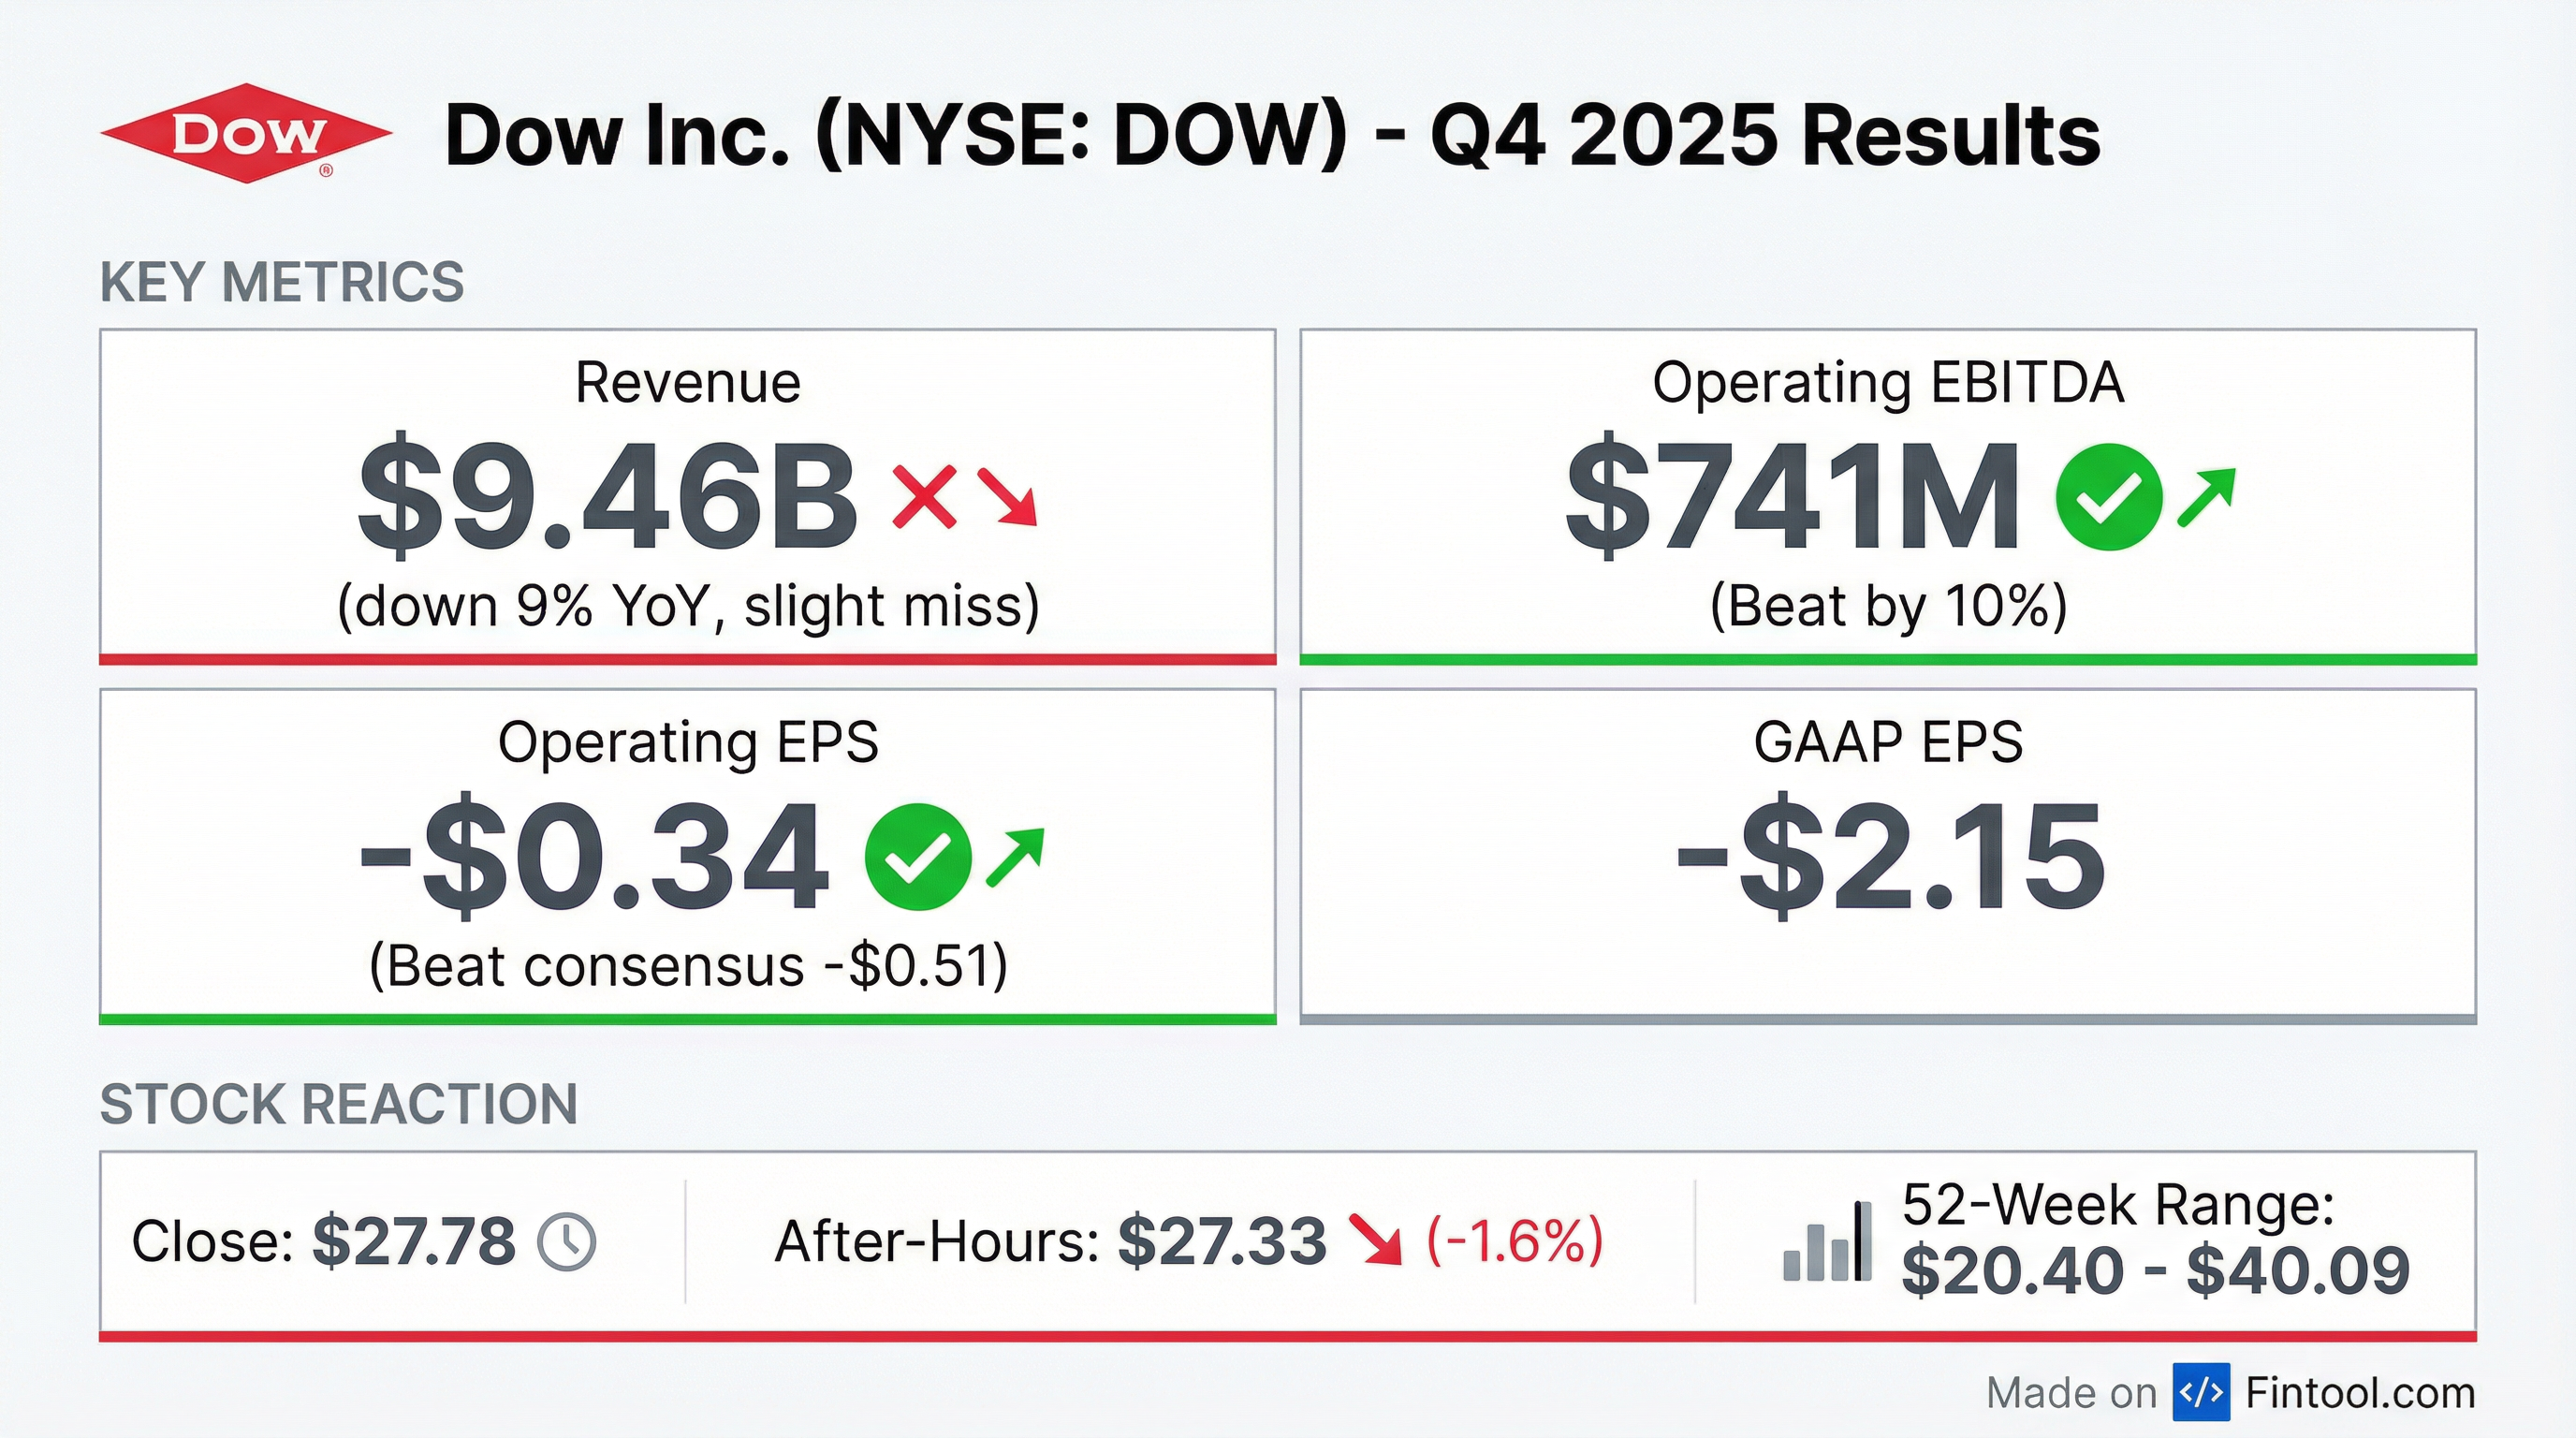
Dow Inc. (NYSE: DOW) reported Q4 2025 results that beat profitability expectations despite continued revenue weakness. Operating EBITDA came in at $741M, while Operating EPS was a loss of $0.34, beating the -$0.51 consensus by $0.17. Full year 2025 delivered $40.0B in net sales and $3.3B in Operating EBITDA, with $1.5B returned to shareholders. The headline: Dow's Transform to Outperform initiative is expected to deliver more than $2B in near-term Operating EBITDA uplift, with benefits accretive to 2025 earnings levels.
Did Dow Beat Earnings?
Mixed results: EPS and EBITDA beat, revenue slight miss.
*Values retrieved from S&P Global
The EPS beat was driven by $165M of in-period cost savings and CapEx down $199M YoY to $568M in Q4. Dow has delivered well over half of its >$6.5B in near-term cash support measures.
What Is Transform to Outperform?
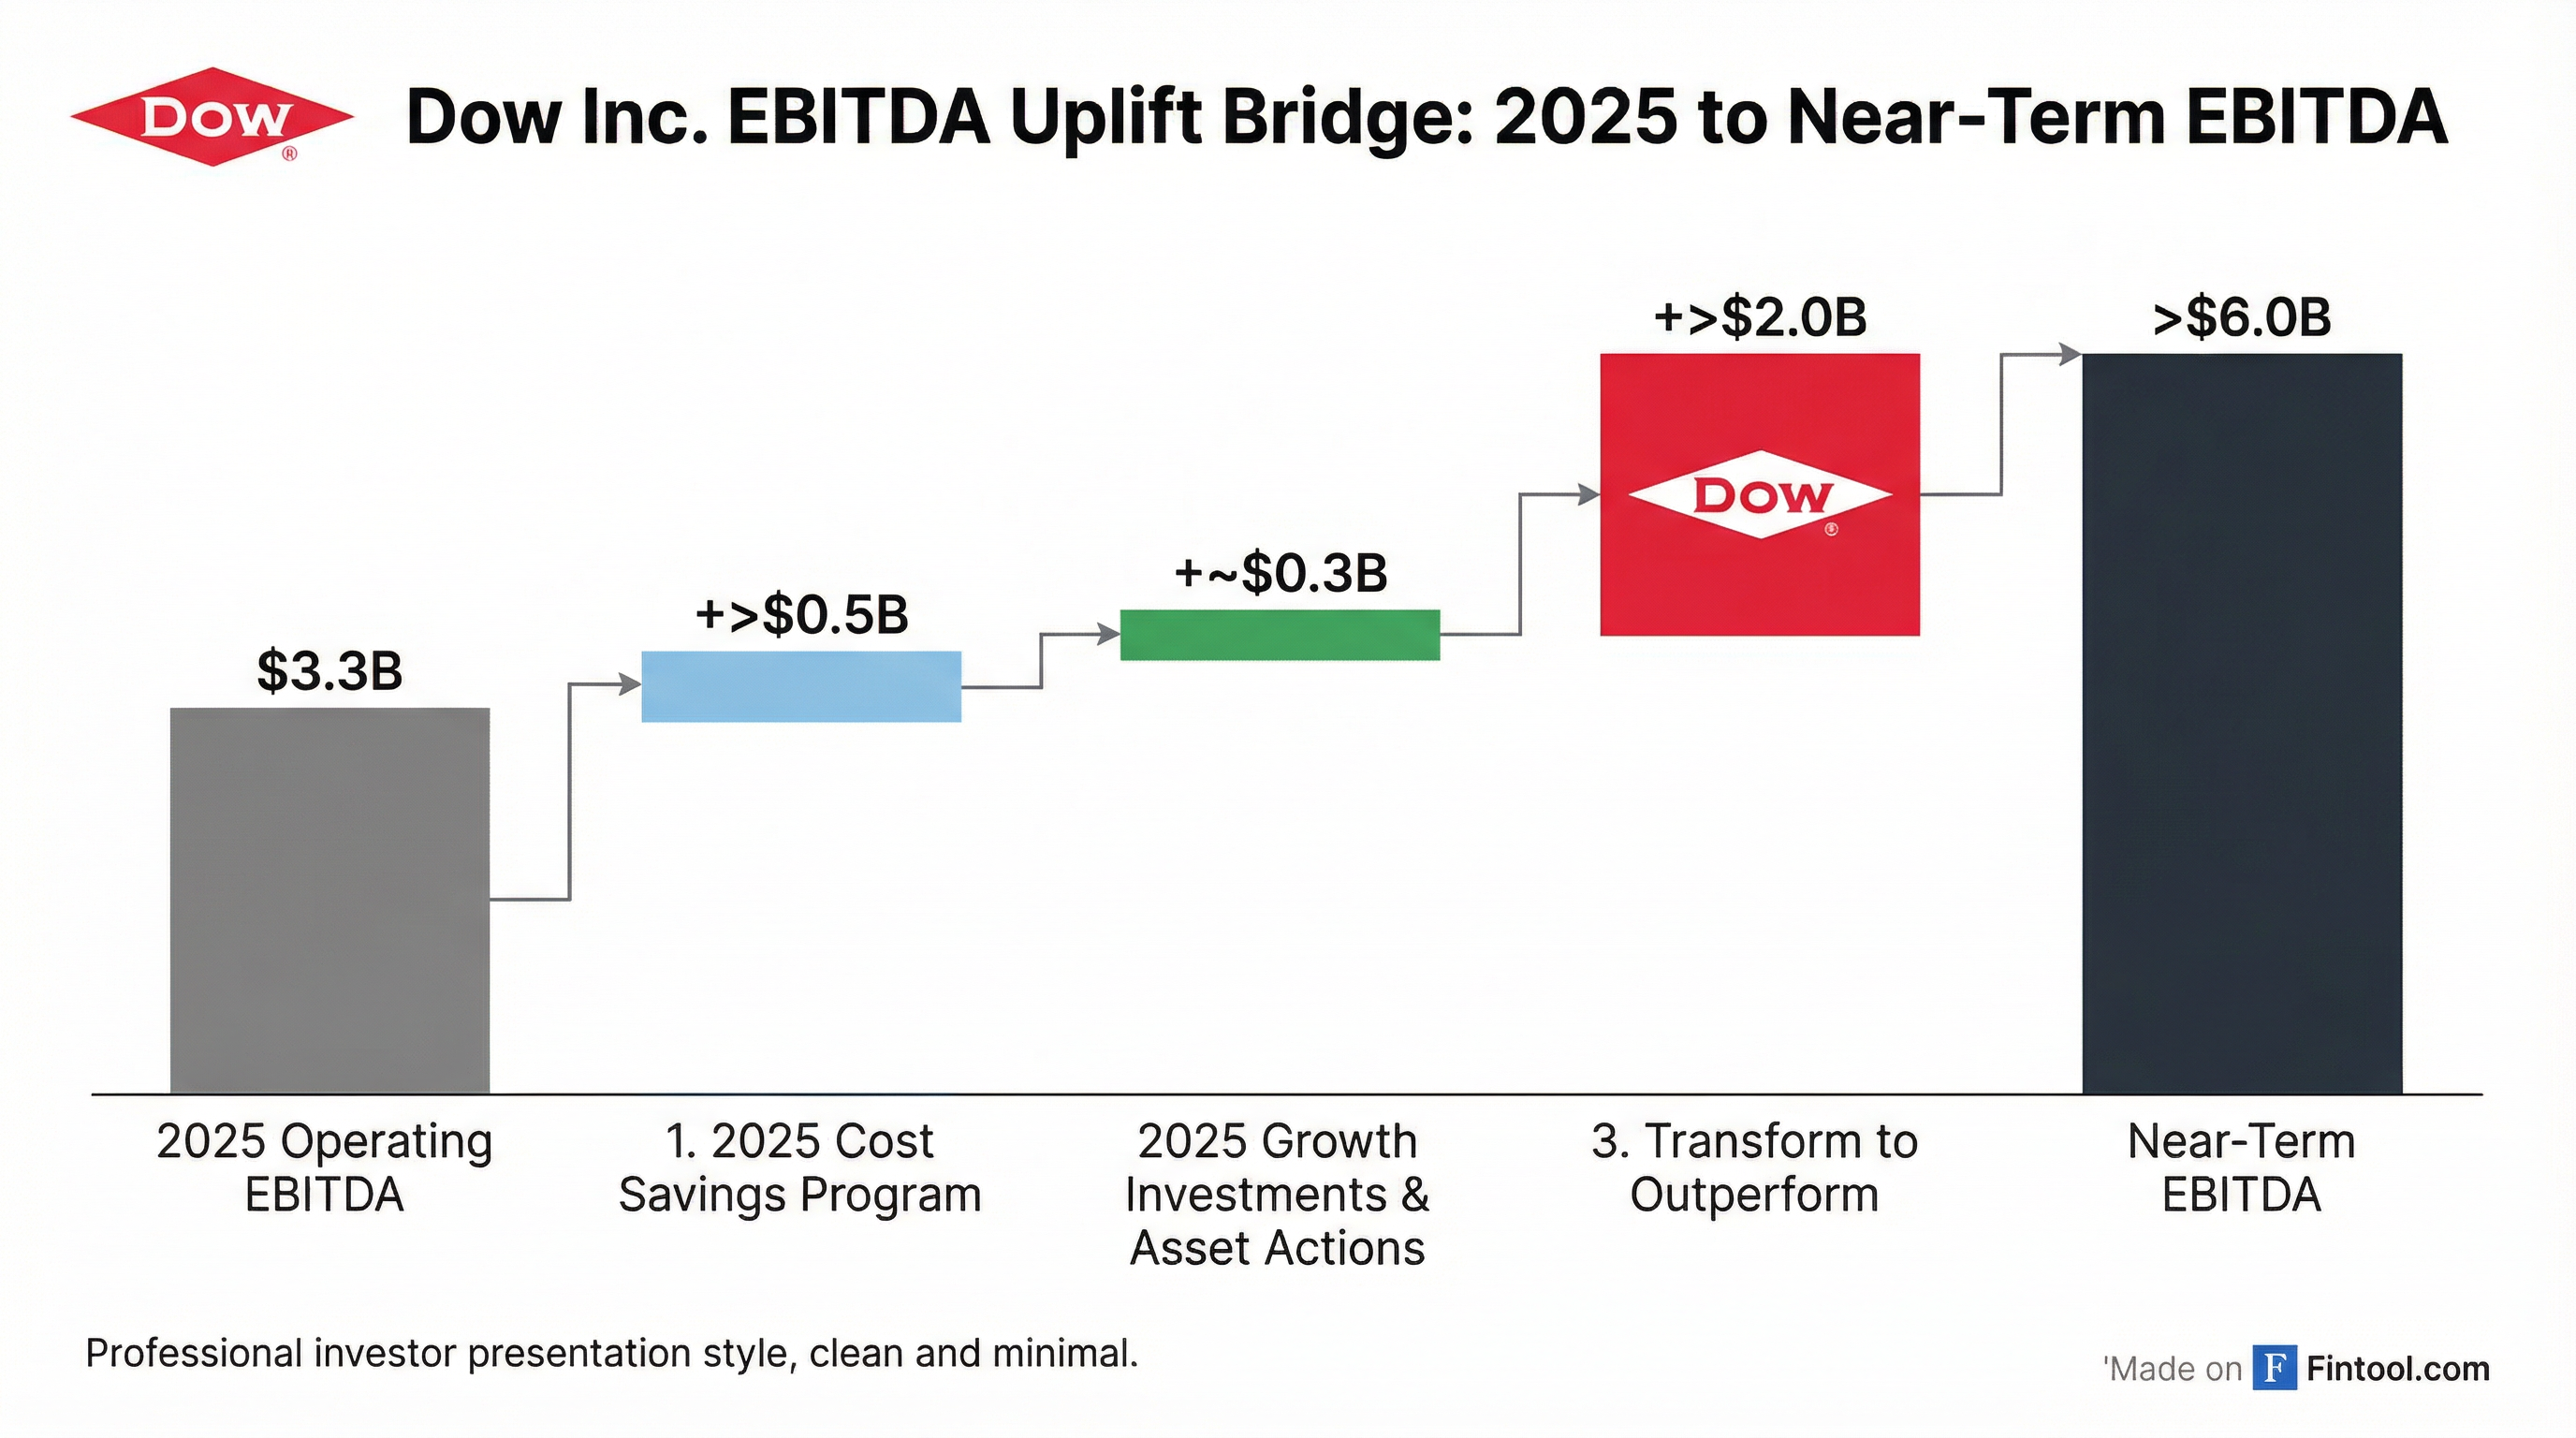
Dow announced a comprehensive transformation program expected to deliver >$2B in near-term Operating EBITDA uplift:
Scope of Changes:
- ~4,500 Dow role reductions plus reduction in 3rd party resources
- Redesigned organizational structure to reduce management layers
- Streamlined end-to-end work processes leveraging automation and AI
- Reset cost structure with focus on raw material sourcing and logistics efficiencies
Expected Timeline:
Cash Costs to Achieve: ~$1.1-1.5B
- ~$600-800M in one-time severance costs
- ~$500-700M in other one-time costs
What Changed From Last Quarter?
Sequential decline driven by seasonality, not structural deterioration.
Sequential drivers by segment:
- Packaging & Specialty Plastics: Lower integrated margins offset by lower fixed costs (Op. EBIT +$16M QoQ)
- Industrial Intermediates & Infrastructure: Lower integrated margins and operating rates (Op. EBIT -$154M QoQ)
- Performance Materials & Coatings: Seasonally lower demand, higher maintenance activity (Op. EBIT -$55M QoQ)
How Did Segments Perform?
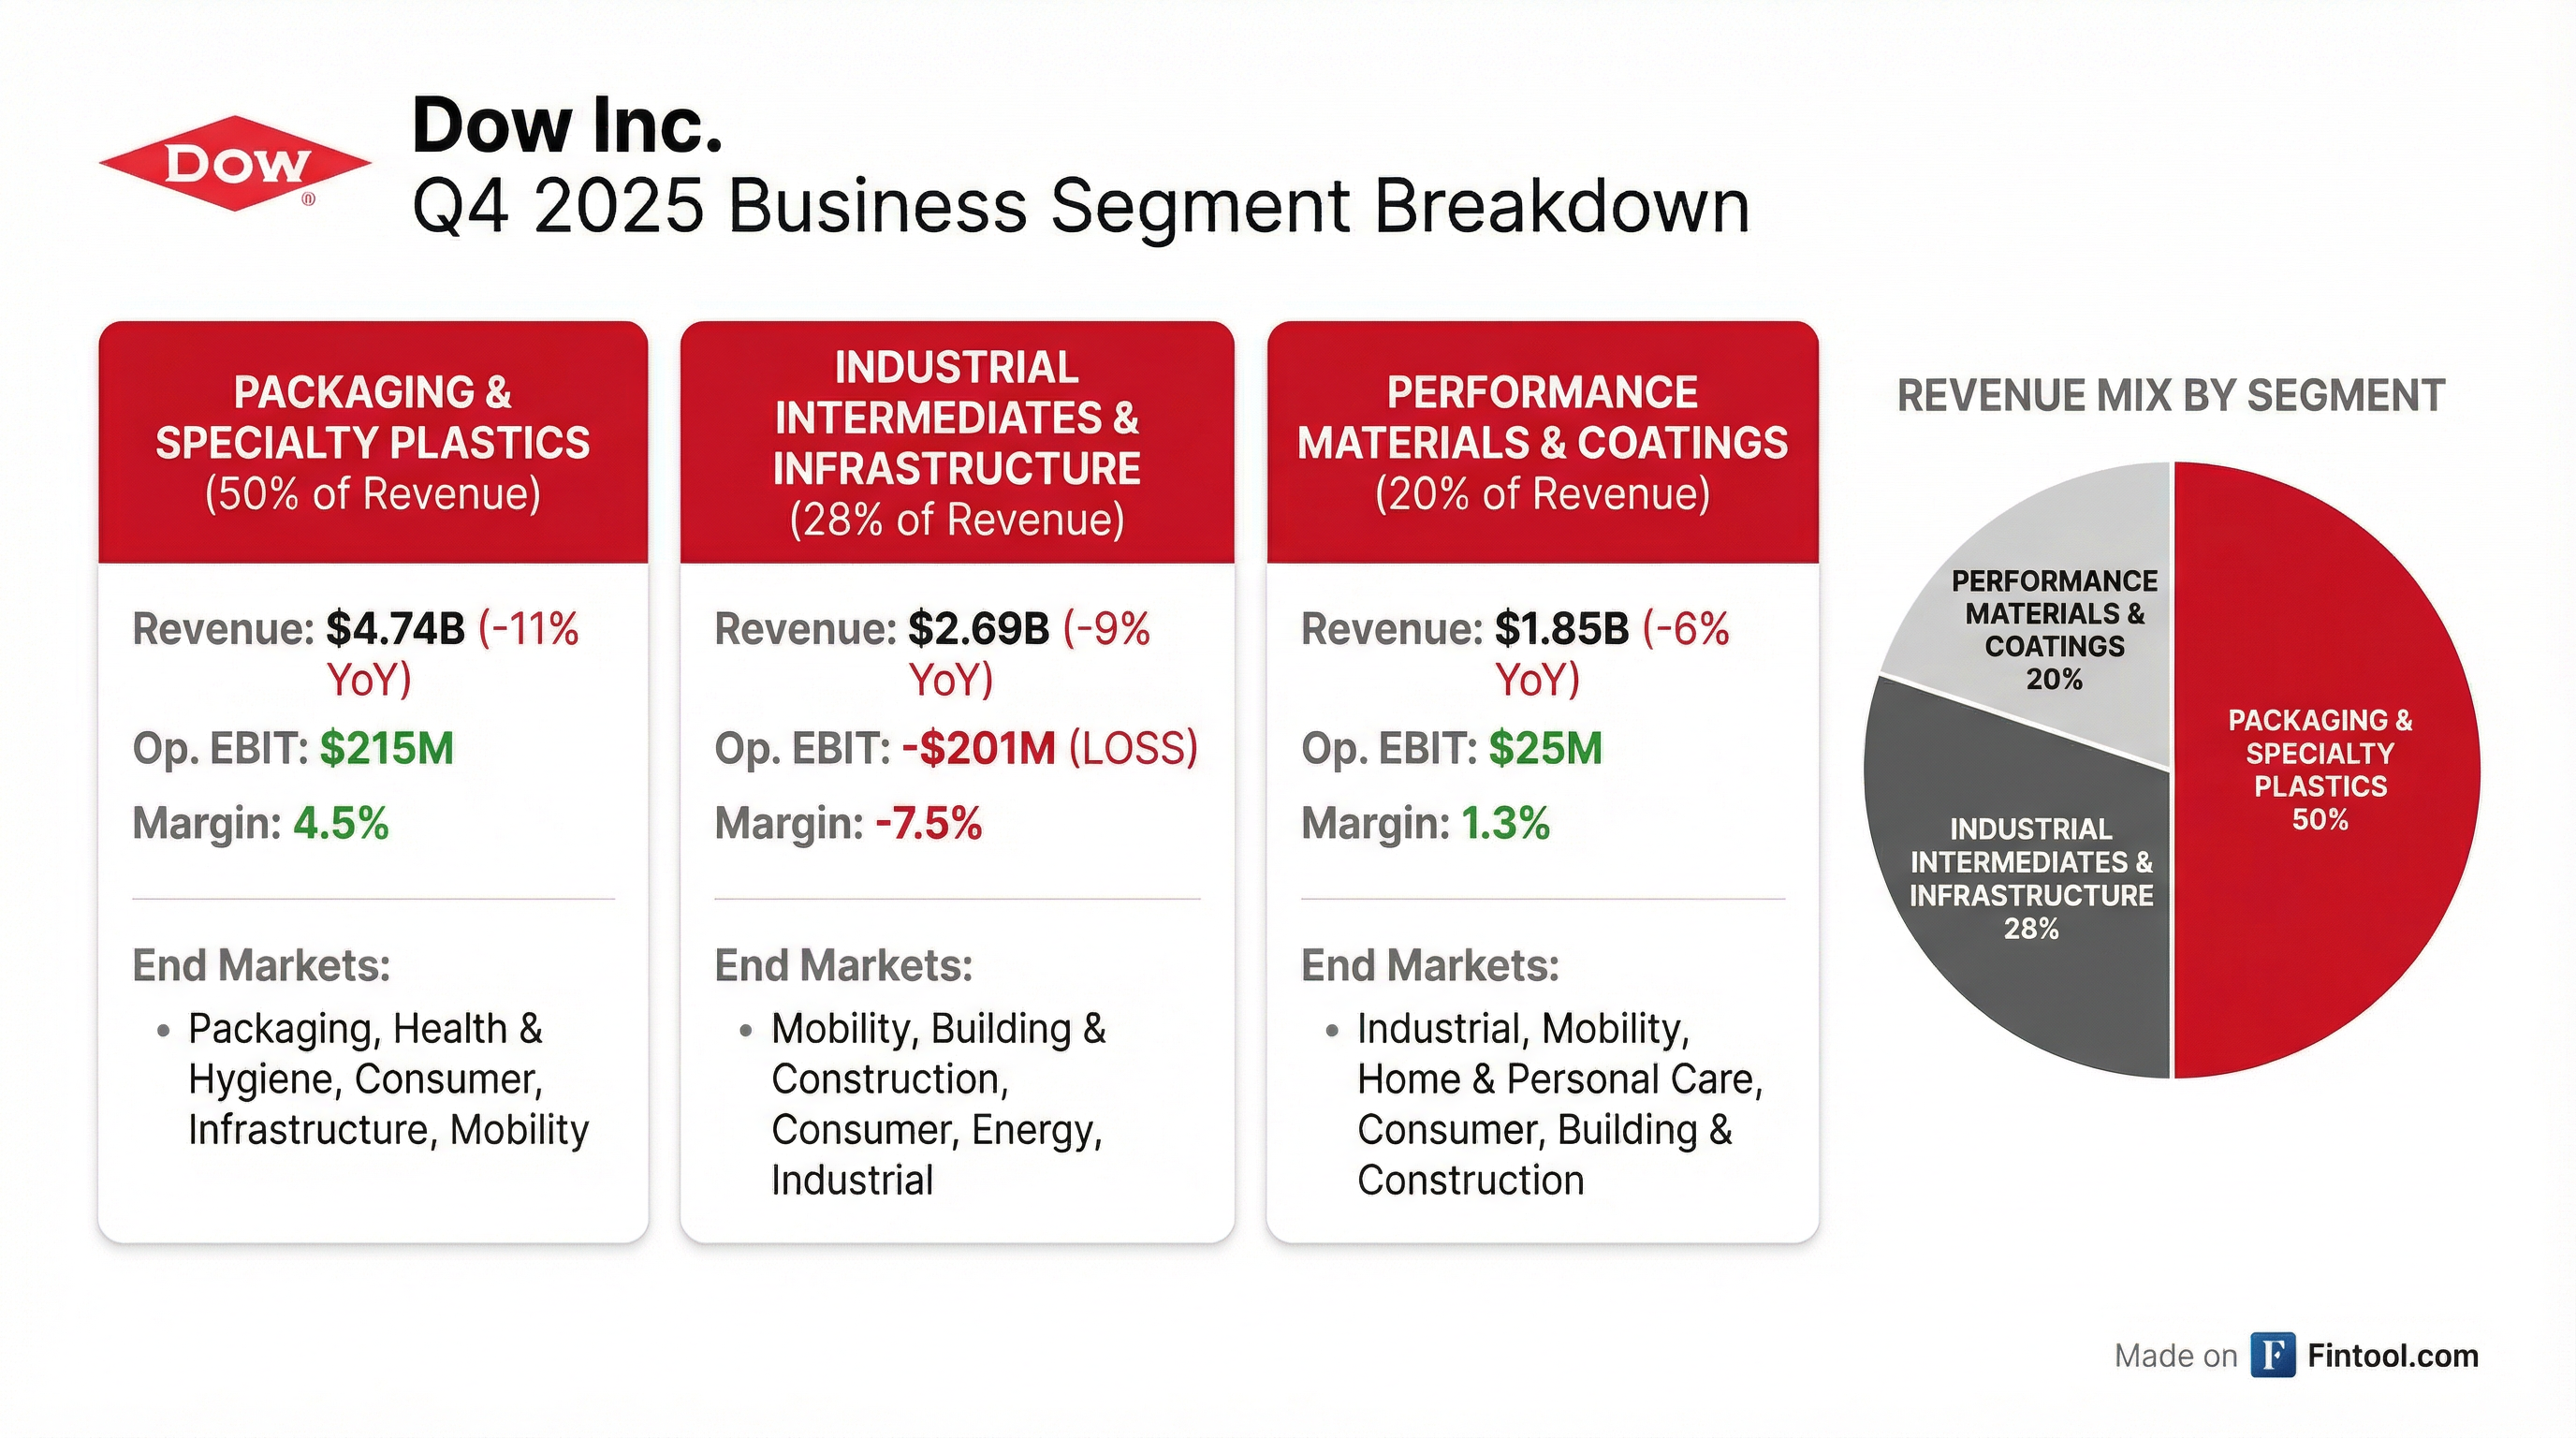
Packaging & Specialty Plastics (50% of revenue)
Drivers: Lower integrated margins and operating rates, partly offset by lower fixed costs.
Industrial Intermediates & Infrastructure (28% of revenue)
Drivers: Lower integrated margins and equity earnings, partly offset by cost reduction tailwinds.
Performance Materials & Coatings (20% of revenue)
Drivers: Lower fixed costs. The bright spot — Op. EBIT improved YoY despite revenue decline.
What Did Management Guide for Q1 2026?
Q1 2026 Modeling Guidance:
Segment Outlook (Q1 2026 vs Q4 2025):
What's the Path2Zero Project Update?
Dow announced its Alberta ethylene cracker project will proceed:
Why Proceed?
- Highest value-creating option of potential scenarios
- First-quartile cost position maintains project merits
- Industry capacity rationalization improving utilization outlook
- Positions Dow for peak returns in next upcycle
How Is Financial Flexibility?
~$14B in liquidity at year-end 2025
Delivered in 2025:
- ~$3B from strategic infrastructure partnership
- ~$1B lower CapEx than original plan
- ~$450M in advance payments from low-carbon supply agreements
-
$400M in cost reduction actions
- ~$250M from 2 non-core divestitures at 10x multiples
Expected Cash Upside in 2026:
-
$500M from 2025 cost savings program completion
- ~$500M from Transform to Outperform
- ~$100M from growth investments and asset actions
- ~$1.2B cash compensation from NOVA litigation
- ~$500M working capital release
How Did the Stock React?
DOW shares closed at $27.78 before the earnings release. After-hours trading:
- After-Hours Price: $27.33 (-1.6%)
- 52-Week Range: $20.40 - $40.09
- Market Cap: ~$19.7 billion
Despite the EPS beat, the muted reaction may reflect concerns about:
- Q1 2026 guidance implying continued headwinds
- $1.1-1.5B in cash restructuring costs ahead
- Path2Zero CapEx of $7.5B through 2030
Global Demand Outlook
Management's view by end market:
FY 2026 Modeling Considerations
Q&A Highlights
On Industry Rationalization and Path2Zero Timing (Hassan Ahmed, Alembic Global):
Management confirmed 15-20% of European ethylene capacity is now announced for rationalization. CEO Jim Fitterling defended the Path2Zero decision: "Path to Zero will put another cracker in the first quartile for us, while we exit positions that are in the fourth quartile. I think that's something that we have to do in every cycle."
On Export Market Exposure (Mike Sison, Wells Fargo):
Management disclosed 30-40% of Packaging & Specialty Plastics volumes from North American assets go to export markets. Key factors supporting this strategy: ethane cracking cost advantage and differentiated product mix not available globally.
On Integrated Margin Outlook (Chris Parkinson, Wolfe Research):
COO Karen Carter noted November 2025 was "the highest monthly volume of 2025 and actually set a total sales record, both from a domestic perspective as well as export." Industry inventories drew down 400 million pounds through November, supporting January price increases.
On II&I Weakness (Kevin McCarthy, Vertical Research):
Building & construction markets "just continue to be under pressure, not just domestically, but around the world." The polyurethanes strategic review continues with no formal decision announced. Management highlighted the 20% North American PO capacity reduction completed in Q1 and trade actions gaining traction, including China's elimination of the 13% export duty drawback effective April 2026.
On Sadara JV (Duffy Fischer, Goldman Sachs):
"Dow and Aramco are conducting an ongoing strategic review of Sadara, which is targeted to be completed during the first half of 2026." No cash payments to Sadara lenders expected in 2026 due to ample liquidity.
On AI's Role in Transformation (Frank Mitsch, Fermium Research):
Fitterling outlined AI applications across functions: "We're seeing progress in many functions right now... in legal, for example, patent research work... doing discovery on cases." Traditional AI with drones and crawlers is eliminating scaffolding costs in turnarounds. The company built an "intelligent data hub" to enable AI-driven process reengineering.
On Feedstock Outlook (Matthew Blair, TPH):
Ethane pricing at $0.20-$0.23 with frack spread of ~$0.25 per million BTU — considered normal. Management expects ~8% growth in fractionation capacity by end of 2027, supporting NGL availability despite competing AI/LNG demand.
Risks and Concerns
- Execution risk: Transform to Outperform requires $1.1-1.5B in restructuring cash and 4,500+ job eliminations
- Path2Zero capital intensity: $7.5B CapEx commitment through 2030; returns now expected 8-10% (reduced from prior estimates due to delay)
- European exposure: Shutdowns of Barry siloxanes (mid-2026), Böhlen cracker (2027), and Schkopau CAV (2027) still in progress
- Joint venture uncertainty: Sadara strategic review underway with completion targeted for 1H 2026
- Prolonged industry downturn: Global demand environment unchanged; building & construction markets remain pressured globally
What to Watch Going Forward
Key catalysts:
- Transform to Outperform implementation updates (1H26 target: ~$100M EBITDA)
- NOVA litigation cash receipt (~$1.2B expected)
- European asset shutdown progress (Barry siloxanes by mid-2026)
- Path2Zero construction milestones
- Industry capacity rationalization announcements
Analysis based on Dow Inc. Q4 2025 earnings presentation, 8-K filing, and earnings call transcript dated January 29, 2026, and S&P Global consensus estimates.